
Introduction
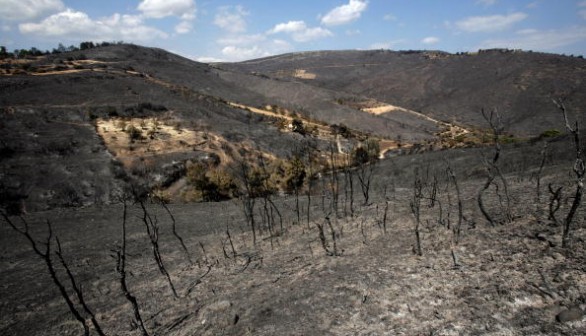
Wildfires bring several dangers and impacts to the wildlife, physical structures, and humans within the local region. Each fire contains it’s own identity in size, intensity, impacts, and other attributes. The previous blog within this series focused on the underlying positive affects of wildfires, primarily within the ecosystem. Although great changes can occur with a wildfire, additional negative consequences will likely result from the same fires, such as the burn scar left behind in the image below. This burn scar allows for a fully vulnerable environment for flooding, erosion, landslides, and other environmental issues. However, these relatively localized events appear to be increasing by the day, year, and century. Could that increase be correct and due to climate change? In this blog, statistical analysis and trends will be examined to communicate the direct relation between climate change and the leaps and bounds of increasing wildfires.
Climate Driven Fires
With a warming climate, wildfires have actively increased incrementally for decades across the United States. However, the steady increase has been significant since 1985. With the increasing burning of wildfires, wildlife and humanitarian hazards have risen as well. While a small wildfire creates problems from habitat loss to poor air quality, these issues exponentially increase when acreage is burned. This trend has also increased since the mid 1980’s by over 5,000,000 acres per year. Wildfire seasons during the early 2000’s, as well as 2011-2012, and 2015 have played key roles in elevating the pace of burning fires. Since 2015 not included within this dataset, several additional years including 2018, 2019, and 2021 saw near record values set for burned acreage and number of fires. According to Verisk Wildfire Risk Analytics, California alone saw over two million properties at risk in 2021. Montana was the leading state however at 29% of the entire state’s properties at risk due to wildfires that scorched the Earth’s surface. With the exception of the 1991 Oakland Fire, nine of the top ten all time costliest wildfires have occurred since 2007, with the other eight fires taking place in the last five years. Although this dataset illustrates the entire country as an average, some regions of the south and western United States are burning faster than others and with a more frequent rate.
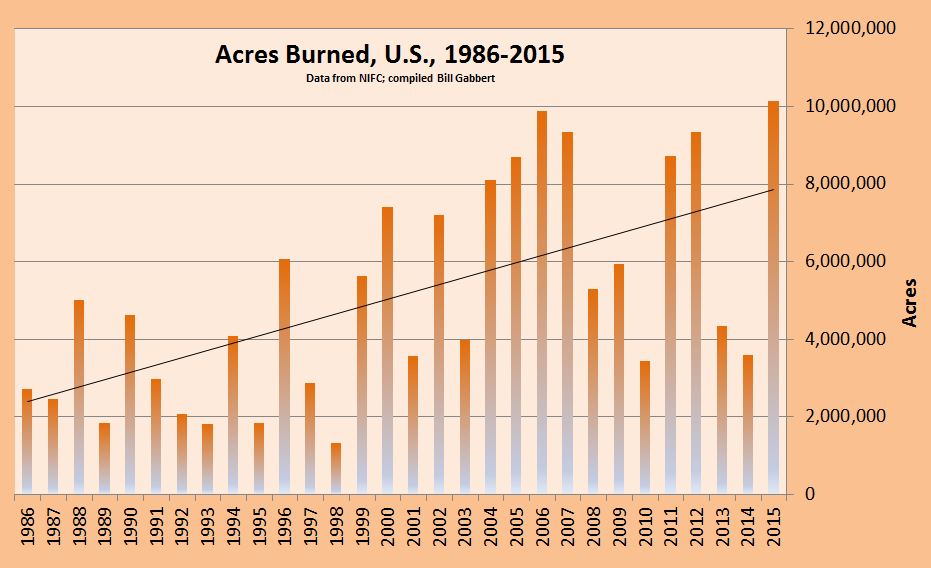
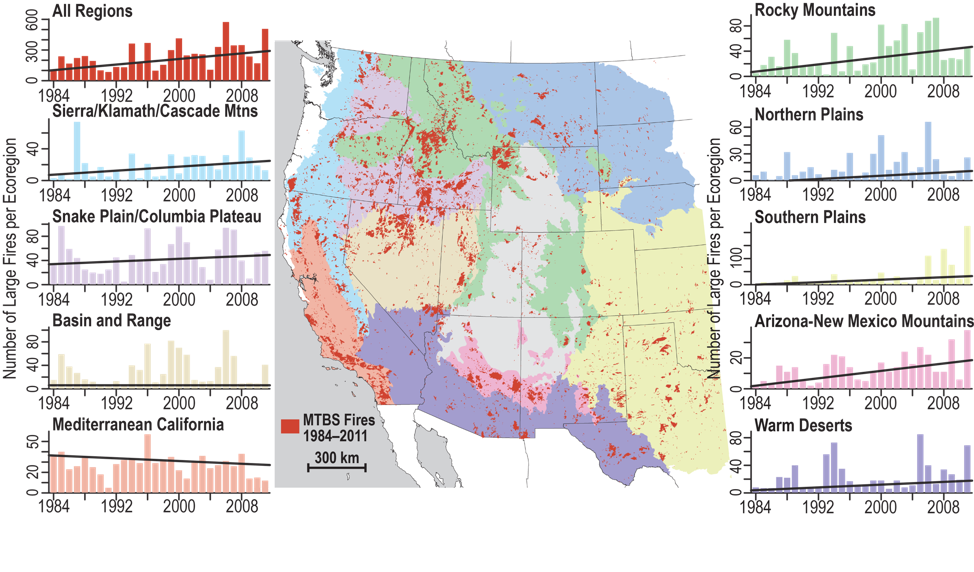
Although the above graph does a wonderful job of indicating the increasingly burned land, it fails to differentiate the specific regions that are suffering from this hazard. With ten defined regions listed below, only the Basin and Range region is not increasing overall in number of large fires or acreage burned. Hot spot region across the western states appears closer towards the Mexican border, with a hotter and drier climate. Drought conditions are prevalent across much of this region during the warm season, with little to no snowfall during the winter months. In 2020, Arizona burned 978, 519 acres, the second most ever in recorded state history. Wildland fire investigators have indicated that 82% of these fires were anthropogenically caused.

In comparison, regions across the Pacific Northwest and throughout the California and Nevada states are also suffering at a high pace. The primary difference here is the lack of snowfall during the winter months, as can be seen above from data released by Science Magazine. With warming winters and less snowpack, the mountains are unable to supply valley regions with water to begin the spring season. That lack of snowpack and early season water create additional fuel and sets the stage for an early fire season. Early melting days are becoming more common to begin spring, leading to enhanced fuel availability and ignitions of fires. Research from the University of California Irvine indicates that the frequency of California fires may increase by 20% by the 2040’s. The total acreage burned may also increase by 25% for this same time period. The only decreasing region of the map is the Mediterranean California region. However, that area has maintained a relatively steady pace and was often much higher in number of large fires before other regions resulting in a consistent but steady quantity of large fires through 2008.
Air & Water Quality
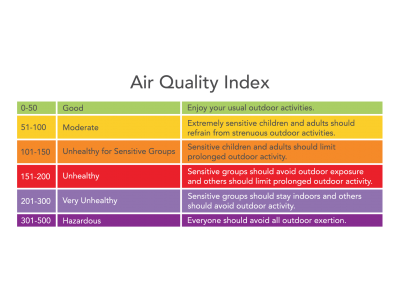
Exhibiting several breath-taking characteristics, the first visual indication of a wildfire is often the tall smoke plumes associated with the fire. The smoke plumes can cause widespread hazards across a large region. It is rare that the smoke and lower air quality remain localized, although the worst air quality will be near the initial wildfire. California’s Air Quality Index is built upon six different levels of health impacts. The smoke and soot from each of these fires can travel hundreds of miles in any direction. This will not only impact those near the fire itself, but also communities downstream from the event. Individuals with a respiratory illness and chronic health hazards are often the most at risk during this time, although alerts from the National Weather Service are in place to communicate the dangerous air quality. The wind speed and direction, as well as the local topography, will play key roles in determining what locations receive the worst air pollution. Locations that are situated within a low valley and surrounded by steep mountains or hills have the greatest potential to see an inversion take place. This will trap the low air quality and particulate matter suspended within the air in the valley for an extended period of time until fresher and cleaner air is mixed into the valley regions. Increasing the pollution at the lower levels and trapping it into valleys can lead to increased temperatures due to the lack of cooling from the particles floating throughout the air. This lack of clean air can also have a direct impact on the availability and health of local bodies of water.
In addition to the lowering air quality, water quality and availability can be strained as well during these fires and after the burning is complete. With extensive runoff taking place due to the lack of trees and vegetation, erosion and flash flooding are possible due to the baren land. During flash flooding, the force of water will allow for anything in its path to become incorporated into the ongoing flood and wave of water. With debris and other chemicals mixing into the water, the health of the waterway actively decreases. The potential for blocking streams and rivers is also possible with large pieces of debris, such as full-sized trees, structural debris, or boulders. These items not only back up the water resource, but also aid in contamination from fire repellant and retardant to other runoff issues that are taking place upstream. When finally released, the water is not drinkable for those who rely upon its resource. Finally, wildfires can force significant runoff and damage to the environment by damaging infrastructure and energy grids. By damaging the pipelines and avenues in which water is treated and released to businesses and residential housing, as well as the power grids that supply energy to these facilities, water can’t be released in a healthy manor, nor can it be properly processed. Each of these events can be examined in the YouTube video below, illustrating the need to quickly contain wildfires after igniting.
Erosion & Flooding
Although the post fire visuals may be disheartening, there are additional dangers and hazards that lurk near or below the surface. Soil erosion is a concern after a wildfire has been contained and extinguished. With the landscape burned and lack of vegetation now evident, soil and barren ground now become visible. These patches or large regions of exposed land produce openness for erosion due to the ability to be washed away and degraded with any amounts of rainfall and fire operations, such as water hoses or fire-retardant materials. These materials, by natural or human force, then carry soil and exposed dead vegetation, such as branches and fallen trees, to other locations creating landslide and mudslide hazards. Without the prior vegetation across the region, there is an extensive lack of root systems that absorb water from rainfall. Also, a contributing factor are extensive rainfall amounts that may cause increasing flash flood threats due to a high volume of runoff across the burn scar. Without the root systems and vegetation, there is also a lack of foliage to absorb and reciprocate the water cycle in comparison to flowering, well grown forests or grasslands. These root systems also allow for soil stability and hold the soil and underlying layers in place, creating another barrier against debris flows and mass movements. Although these hazards commonly occur at the burn scar region or nearby, they are often carried downstream into valley regions and other locations leading to a local but damaging impact on humanitarian efforts.

Mass Land Movements
Due to the natural changes in the landscape during and after wildfires, mass debris movements are common across the western regions of the United States. Mudslides, debris flows, and landslides are all secondary hazards to the wildfire itself, post extinguishment. However, these can occur near the burn scar or downwind of that location, as previously mentioned. In regions such as the Mountain West, high altitude wildfires create prime conditions to exasperate these mass movements. The angle of the terrain, coupled with the rivers and channels that are present in the natural landscape, aid in the downward flow of these materials. Moving parts of the land often weigh tens of thousands of pounds and occur with little to no warning. Due to the highly variable conditions, they often occur without warning sending residents fleeing the region for safety. The natural force of the water, flowing trees and debris, and pieces of the land are capable of crushing cars, structures, and other objects that may result in additional devastation, injuries, and death. In relation to the flash flooding of water, only six inches of swiftly moving water is required to sweep an individual away. However, only two feet of moving water, with or without debris, can rush away a car or small structure. The YouTube video below is indicative of how quick conditions can deteriorate when the land gives way. Although not directly due to a wildfire, the result in the video is the same in comparison to a wildfire acting as the catalyst in the process of these mass movements. The individuals in the video were faced with a life-or-death decision while fleeing the scene where the landslide began.
Wildlife & Human Loss
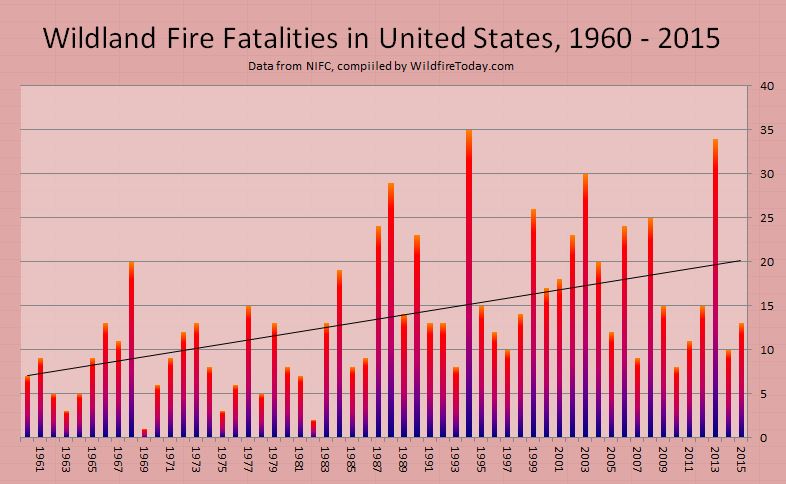
Wildfires commonly draw attention to the landscape and primary operations required to fight the battles. Much has been communicated throughout this blog related to the impacts of the land and downstream effects from wildfires. However, there is one additional piece of information that has yet to be covered and is often buried beneath headlines and that is the human loss during wildfires. Since 1960, wildfire deaths in the United States have had an increased trend annually. Four years have shown significant spikes in reported fatalities including 1989, 1994, 2003, and 2013. Although following each of these individual years saw a decrease in fatalities, the overall trend from the last 55 years has continued to increase. The graph below includes both first responders and civilians, as well as all types of wildfires from natual to anthropogenic. Unfortunately, the increase in wildfires as a whole continues to climb and a warming planet will only enhance that potential. Through proper training and policies, mitigating deaths is a high priority throughout these deadly disasters. However, as with any type of fire, the risk will always remain during and after battling the blaze.
Future Fire Prevention
Wildfires, although often naturally made, can be prevented when caused by anthropogenic activities. Lightning is the primary cause of wildfires when created by a natural force. However, humans cause significant harm to the environment when illegally and irresponsibly discarding cigarette buds, burning trash in reckless habits, and allowing unsupervised fires to burn. A small spark from a campfire can create a large, quick spreading wildfire due to a careless act that easily may have been prevented. State agencies highlight the importance of these tips, often during the warm season months when winds are increasing, when added fuel throughout the forest floors allows for quicker ignition. Although some of these tips may appear to be common sense or rather obvious, there remains reason to continue to advise and communicate these threats and preventative tips to lower the quantity of fires and impacts to those around the region.

Summary
In conclusion, wildfires have increased drastically since the mid 1900’s. Although that increase can be related to anthropogenic causes at times, climate change is undeniably the primary driver in this stark upward trend. Prescribed burns and other activities may reduce wildfires slightly or even lessen the impacts of each of the fires. However, that does not allow for a significant decrease in the quantity of fires overall. Wildfires are increasing in coverage, intensity, and acreage burned. Each of these problems only enhances the impact on wildlife, humanitarian responses, and the environment as a whole. With continued fires and a warming climate, conditions for wildfires will potentially grow in the future with more significant impacts than what are seen at this time. Assessing the current climate, the state of the future, and preparing for worsening conditions based upon statistical trends are three keys to mitigating impacts and improving the health of the atmosphere and ecosystem on a global scale.
Looking Ahead
The fourth blog of this series will focus on the economic effects of wildfires. Money, resources, and manpower are often maximized during the peak of wildfire season. However, it is much easier said than done to save and contain important resources at local, state, and federal levels when lives and property are in danger. Statistical analysis will be completed and examined on the impact’s wildfires have on multiple governmental levels in relation to the spending and resources available to fight the hazards.
Other Resources
Wildfires and Yellowstone’s Stream Ecosystems
https://www.jstor.org/stable/1311002?seq=9#metadata_info_tab_contents
Predicting Climate Change and Future Wildfires
https://wires.onlinelibrary.wiley.com/doi/pdf/10.1002/wcc.92
Biodiversity Impacts of Prescribed Burns and Wildfires
https://esajournals.onlinelibrary.wiley.com/doi/full/10.1890/10-2351.1
USGS Post-Wildfire Landslides of California
Works Cited
Bell, B. (2021, April 22). California’s wildfire season has lengthened, and its peak is now earlier in the Year. UCI News. Retrieved March 19, 2022, from https://news.uci.edu/2021/04/22/californias-wildfire-season-has-lengthened-and-its-peak-is-now-earlier-in-the-year/
National fire news. National Fire News | National Interagency Fire Center. (2022, March 28). Retrieved March 28, 2022, from https://www.nifc.gov/fire-information/nfn
Neary, D. G., & Gottfried, G. J. (2003, January). Post-wildfire watershed flood responses – postfiresw.info. Retrieved March 25, 2022, from https://postfiresw.info/sites/postfiresw.info/files/Neary_2003.pdf
Pacific Southwest Research Station. USDA Forest Service. (n.d.). Retrieved March 30, 2022, from https://www.fs.fed.us/psw/topics/fire_science/ecosystems/erosion.shtml
U.S. fire deaths, fire death rates, and risk of dying in a fire. U.S. Fire Administration. (2021, November 15). Retrieved March 20, 2022, from https://www.usfa.fema.gov/data/statistics/fire_death_rates.html
Wildfire Community Preparedness Day. NFPA. (2021). Retrieved March 19, 2022, from https://www.nfpa.org/wildfireprepday

Leave a comment